The Real Cost of Waiting for “Perfect” Interest Rates
What if the home of your dreams is slipping through your fingers while you wait for interest rates to drop?
Discover If You’re Losing Money Every Day You Wait
The BuyNowIQ calculator analyzes your specific situation to determine whether buying now at current rates or waiting for lower rates makes more financial sense for YOU.
Dear Future Homeowner,
You wake up each morning in a place that doesn’t quite feel like yours. Perhaps it’s the rental where your landlord just raised the rent again. Maybe it’s the starter home your family has outgrown, with toys cluttering every corner and no space to breathe. Or perhaps it’s the too-large empty nest, with rooms that echo with memories but drain your bank account with unnecessary upkeep.
You’ve been telling yourself the same story: “I’ll make my move when interest rates come back down.”
But what if that’s the most expensive decision you could make?
What if, by waiting, you’re actually losing money every single day?
The Hidden Mathematics of Homeownership That No One Talks About
Most financial advisors, real estate agents, and well-meaning friends are getting it wrong. They focus solely on interest rates while ignoring the complex ecosystem of factors that truly determine whether now is your time to buy.
The conventional wisdom says: “Wait for lower rates.”
The mathematics say: “The cost of waiting often exceeds the benefit of a lower rate.”
The Real Estate Truth That Changed Everything
In 1981, mortgage rates hit an all-time high of 18.45%. Imagine that—paying nearly a fifth of your loan amount annually just in interest.
Those who waited for rates to drop to “reasonable” levels in the early 1980s missed one of the greatest wealth-building opportunities in American history. Why? Because while they waited, home prices in most markets increased at a pace that dwarfed the eventual savings from lower interest rates.
History doesn’t just rhyme—it repeats with mathematical precision.
Why Waiting to Buy Could Cost You Thousands
Let’s consider a hypothetical $400,000 home purchase:
Scenario A: Buy Now
- Home Purchase Price: $400,000
- Down Payment: $80,000 (20%)
- Current Interest Rate: 6.50%
- Monthly Payment: $2,528
Scenario B: Wait One Year
- Home Purchase Price: $412,000 (3% appreciation)
- Down Payment: $82,400 (20%)
- Target Interest Rate: 5.50%
- Monthly Payment: $2,271
The monthly payment is lower in Scenario B by $257 per month.
But here’s what this simplistic comparison misses:
Based on your inputs, buying now appears to be financially advantageous.
Net Benefit of Buying Now: $16,386
Today’s Housing Market: A Perfect Storm of Opportunity Hidden Behind the “High Rate” Smokescreen
Consider these facts that mainstream financial media isn’t emphasizing:
Las Vegas Real Estate: A Decade of Impressive Growth
The Las Vegas/Clark County market has demonstrated remarkable resilience and growth over the past decade. Here’s the year-by-year appreciation data that illustrates why waiting in this market has historically been a costly decision:
Clark County Home Price Appreciation (2013-2023)
If you had waited for “perfect” interest rates over the past decade in Las Vegas, you would have seen the average home price more than double. Even factoring in periods of higher interest rates, the appreciation in this market has consistently rewarded those who entered the market sooner rather than later.
While past performance doesn’t guarantee future results, the BuyNowIQ calculator allows you to input your own appreciation projections based on your assessment of the market.
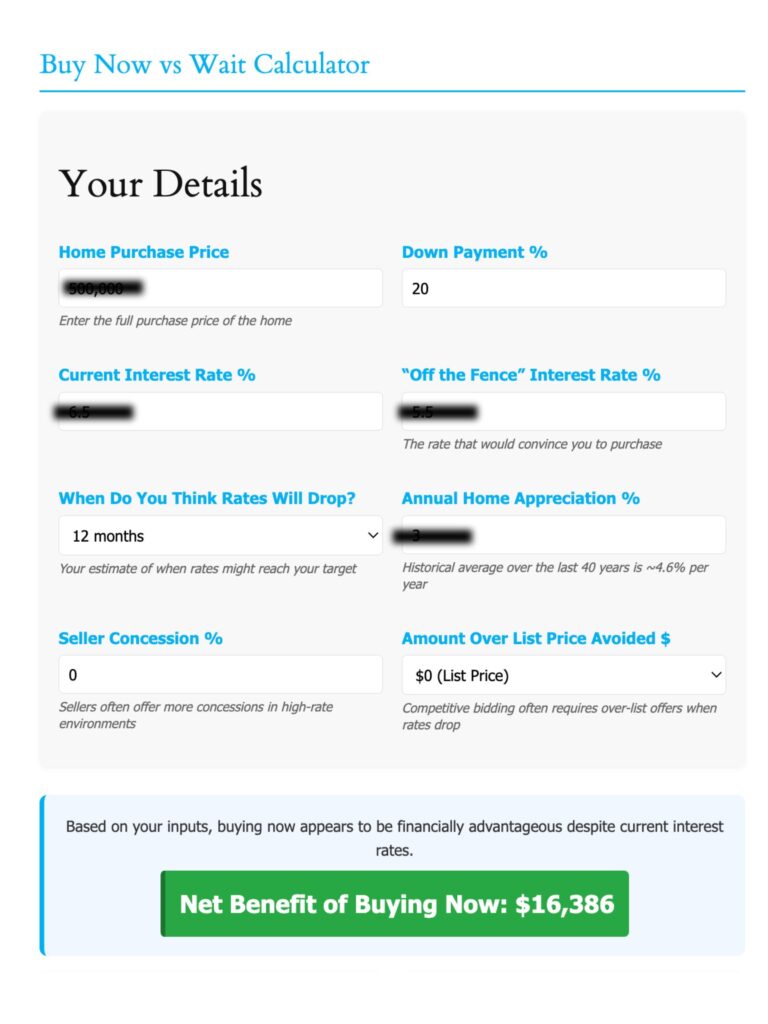
Screenshot of calculator
The Four Most Common Housing Scenarios (And How to Navigate Them)
1. The Trapped Renter
You’re paying ever-increasing rent while watching homeownership slip further away as prices rise.
Rapidly Increasing Rent
Rent has increased 24% nationally since 2020, with no signs of slowing down.
Growing Down Payment
For every year you wait, the down payment needed on a $400K home increases by $4,000 (at 5% appreciation).
Lost Tax Advantages
The average annual tax benefit from mortgage interest and property tax deductions.
Lost Equity Building
The approximate amount of principal you’ll pay down in your first year of mortgage payments.
2. The Space-Constrained Family
Your family is growing, but your home isn’t. Every day brings more challenges as you try to make your current space work.
Renovation vs. Moving
The cost per square foot to add on to your home, often exceeding the cost of upgrading.
Family Harmony
Percentage of families reporting better relationships after moving to a more spacious home.
School District Timing
Optimal months for school transitions, which may not align with waiting for interest rates.
Growth Area Appreciation
Additional annual appreciation rate in family-friendly neighborhoods compared to general market.
3. The Empty-Nest Maintainer
You’re paying to heat, cool, and maintain space you no longer use. Your home has become both a financial drain and a burden.
Maintenance Costs
Annual maintenance costs for larger, older homes that you’re no longer fully utilizing.
Utility Reduction
Average reduction in utility expenses when downsizing to a more efficient, right-sized home.
Freed Equity
Average amount of equity released when downsizing, providing substantial retirement funds.
Tax Advantages
Capital gains exclusion for married couples when selling a primary residence.
4. The Location Misfit
Your current home is the right size but in the wrong place. Your commute or location no longer meets your needs.
Commuting Cost
Annual cost of a 1-hour commute, including gas, vehicle depreciation, and maintenance.
Quality of Life
Average daily time saved with an ideal location, adding up to 255 hours (over 10 days) per year.
Location Appreciation
Additional annual appreciation in commuter-friendly locations compared to distant suburbs.
Remote Work Setup
Productivity increase with a dedicated home office space in a home that meets your needs.
The BuyNowIQ calculator accounts for your specific housing scenario to provide personalized guidance.

The Historical Context: Interest Rates and Home Prices Through the Decades
Understanding the relationship between interest rates and home prices provides crucial context for today’s decisions:
1970s:
- Average mortgage rate: 8.86%
- Average home price increase: 142% over the decade
- Waiting meant prices more than doubled.
1980s:
- Average mortgage rate: 12.70%
- Average home price increase: 74% over the decade
- Even with high rates, homes appreciated.
1990s:
- Average mortgage rate: 8.12%
- Average home price increase: 46% over the decade
- Stable rates, steady appreciation.
2000s:
- Average mortgage rate: 6.29%
- Average home price increase: 58% over the decade
- Long-term ownership beats downturns.
2010s:
- Average mortgage rate: 4.09%
- Average home price increase: 63% over the decade
- Low rates fueled strong appreciation.
2020s (so far):
- Starting mortgage rate: 3.11%
- Current mortgage rate: ~6.5%
- Home price increase: 42% since 2020
- Prices continue to rise despite higher rates.
Key Insight:
There is no strong correlation between interest rates and long-term home price appreciation. The true financial benefit comes from the length of time you own the home.

The Three Homebuyer Personalities: Which One Are You?
The Perpetual Waiter
- Always looking for the “perfect” time to buy
- Has been renting for years while “saving for a down payment”
- Keeps moving the goalposts—first it was saving enough, then waiting for prices to drop, now waiting for rates to fall
- Will likely pay far more in lifetime housing costs through rent than they would through a mortgage
The Emotional Buyer
- Makes decisions based on feelings rather than financial logic
- Often rushes into purchases without understanding the full financial picture
- May either buy too impulsively or wait unnecessarily
- Needs objective data to balance their emotional approach
The Strategic Homeowner
- Understands that personal timing usually outweighs market timing
- Makes decisions based on comprehensive data, not just interest rates
- Recognizes that building equity, even at higher rates, often outperforms renting and waiting
- Leverages tools like the BuyNowIQ calculator to make confident, informed decisions
The Next Step: Getting Your Personalized BuyNowIQ Analysis
Making the right housing decision requires personalized analysis based on your specific circumstances, location, and goals.
That’s why we’ve made the BuyNowIQ calculator available to you—to cut through the noise of generalized advice and give you clarity on your specific situation.
To access your personalized BuyNowIQ analysis:
- Click the button below to go to the sign-up page
- Enter your email to gain immediate access to the full-featured calculator
- Input your specific details
- Receive a comprehensive report on whether buying now or waiting is the better financial decision for YOU
Data sources: Federal Reserve Economic Data (FRED), National Association of REALTORS®, S&P CoreLogic Case-Shiller Home Price Indices, U.S. Census Bureau, Freddie Mac Primary Mortgage Market Survey, Las Vegas REALTORS® (formerly Greater Las Vegas Association of REALTORS®)
Disclaimer: The BuyNowIQ calculator provides projections based on historical data and current market trends. These projections are for informational purposes only and should not be considered financial advice. Always consult with qualified financial and real estate professionals before making housing decisions.